


The Consumer Price Index (CPI) is a monthly measure of the change in prices paid by consumers for goods and services.
It is an index that measures the change in the price of a representative basket of goods and services such as food, energy, housing, clothing, transportation, medical care, entertainment, and education.
What is CPI?
The CPI is the measurement used by economists for tracking price changes in a typical “basket” of goods and services that consumers purchase.
The Bureau of Labor Statistics (BLS) computes the CPI by taking the average weighted cost of a basket of goods in a given month and dividing it by the weighted cost of the same basket the previous month.
Then, it multiplies this percentage by 100 to get the number for the index.
Why is CPI important?
The CPI measures inflation (a sustained rise in prices in an economy) as experienced by consumers in their day-to-day living expenses
The increase in the CPI is what most people think of as the “inflation rate.”
It is used by retailers in predicting future price increases, by employers in calculating salaries, and by the government in determining cost-of-living increases for Social Security.
Signs of inflation mean the central bank has to raise interest rates. The most widely used indicator of inflation is CPI.
If CPI is increasing, then it gives a central bank such as the Fed the necessary supportive data to hike rates. Higher interest rates are bullish for the country’s currency.
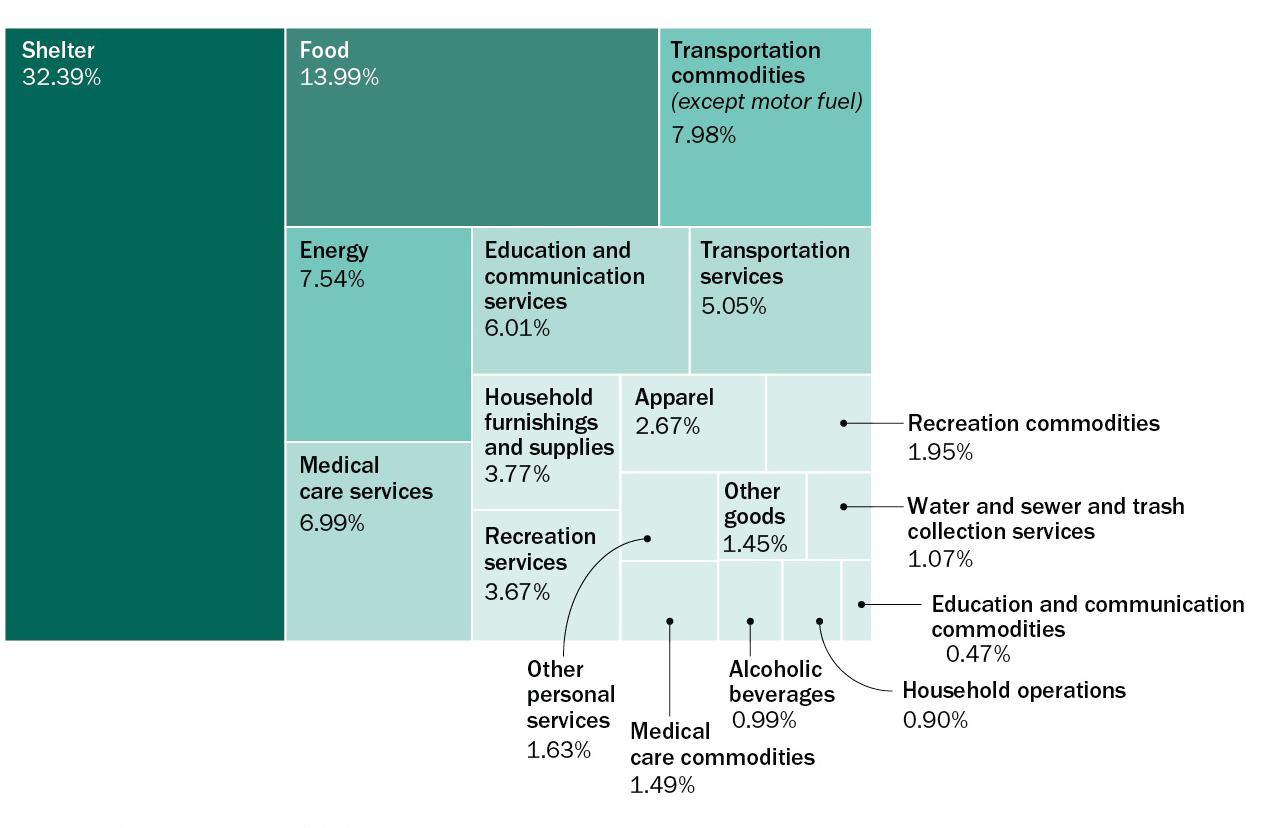
What goes into the Consumer Price Index?
Background of Consumer Price Index (CPI)
The CPI is a measure of the change over time in the prices paid by consumers for a market basket of goods and services.
These goods and services include food, clothing, shelter, and used cars. Items on which the average consumer spends a great deal of money, such as food, are given more weight, or importance, in computing the index than items such as toothpaste and movie tickets, on which the average consumer spends comparatively less.
The CPI does not include investment items, such as stocks, bonds, real estate, and life insurance. These items relate to savings and not to day-to-day consumption expenses.
Each month, data collectors from the Bureau of Labor Statistics (BLS) called economic assistants visit or call thousands of retail stores, service establishments, rental units, and doctors’ offices, all over the United States to obtain price information on thousands of items used to track and measure price change in the CPI.
These economic assistants record the prices of about 80,000 items each month. These 80,000 prices represent a scientifically selected sample of the prices paid by consumers for the goods and services purchased.
During each call or visit, the economic assistant collects price data on a specific good or service that was precisely defined during an earlier visit.
If the selected item is available, the economic assistant records its price. If the selected item is no longer available, or if there have been changes in the quality or quantity (for example, eggs sold in packages of 8 when previously they had been sold by the dozen) of the good or service since the last time prices had been collected, the economic assistant selects a new item or records the quality change in the current item.
The recorded information is sent to the national office of BLS where commodity specialists, who have detailed knowledge about the particular goods or services priced, review the data.
These specialists check the data for accuracy and consistency and make any necessary corrections or adjustments. These can range from an adjustment for a change in the size or quantity of a packaged item to more complex adjustments based on a statistical analysis of the value of an item’s features or quality.
Source
Bureau of Labor Statistics, Department of Labor
Availability
It is released at 8:30 am EST on the second or third week following the month being covered.
Frequency
Monthly.
Revisions
No monthly revisions.
Additions
The Consumer Price Index or CPI as it is more commonly known is also sometimes referred to as the ”Retail Price Index” and is often considered the most widely used and most accurate measure of inflation and tends to also be regarded as an indicator of the effectiveness of the current government policies.
Essentially, the CPI is a “basket” of various consumer goods and services that have been purchased by the wage earners of certain urban areas and which have been tracked from month to month.
The CPI is a fixed quantity price index and also a form of cost of living index and is considered one of the most useful tools in financial circles as it can provide clues as to movements in inflation.
When inflation rises, our purchasing power subsequently falls into decline meaning that every dollar earned is capable of buying a lesser percentage of a good or service. While it is typical for The federal reserve to battle rising inflation by increasing short-term interest rates this is often frowned upon by investors because the cost of borrowing increases.
Close attention needs to be paid to the “core rate” as this rate excludes volatile energy and food prices to give a more strict measurement of general prices.
Ideally, within the financial markets, you would generally be looking for the CPI to rise at an annual rate of just 1-2%, as any amount over this would indicate a warning about growing levels of inflation.
CPI can be greatly influenced in any given month by a movement in volatile food and energy prices. Therefore, it is important to look at CPI excluding food and energy, commonly called the “core” CPI
Within the core CPI, some of the more volatile and closely watched components are apparel, tobacco, airfares, and new cars. In addition to tracking the m/m changes in core CPI, the y/y change in core CPI is seen by most economists as the best measure of the underlying inflation rate.
How to trade the CPI report
When the CPI report is released, it’s essential to consider the current market conditions and the broader economic context.
It is a key indicator of inflation, and central banks like the Federal Reserve closely monitor it to make monetary policy decisions.
Here are some factors to consider when interpreting the CPI report:
- Market expectations: Prior to the report’s release, analysts and economists usually provide their forecasts. If the actual CPI numbers deviate significantly from market expectations, it could trigger market reactions, such as fluctuations in stock prices, bond yields, and currency exchange rates.
- Inflation trends: Compare the current CPI data with previous months or years to understand the prevailing inflation trends. If the report shows a consistent rise in the CPI, it could indicate growing inflationary pressures. Conversely, a falling CPI may signal weakening inflation or even deflation.
- Core CPI: The core CPI excludes volatile items like food and energy prices, focusing instead on the prices of other goods and services. The core CPI is considered a more stable indicator of underlying inflation trends. Compare the core CPI with the overall CPI to identify whether specific factors, such as changes in oil prices, are driving the headline inflation rate.
- Central bank’s target: Consider the inflation target set by the Federal Reserve, currently at 2% for the U.S. If the CPI report shows inflation significantly above or below the target, it could influence the central bank’s monetary policy decisions, such as adjusting interest rates or implementing other measures to control inflation.
- Economic factors: Analyze the CPI report in the context of other economic indicators and factors, such as unemployment, GDP growth, and fiscal policies. This will help you better understand the drivers of inflation and gauge the overall health of the economy.
- Market reaction: Observe how financial markets react to the CPI report, including movements in stock prices, bond yields, and currency exchange rates. This will give you insight into how investors are interpreting the data and its potential impact on future monetary policy decisions.
In summary, interpreting the U.S. CPI report involves considering market expectations, inflation trends, core CPI, central bank targets, and the broader economic context.
Understanding these factors will help you anticipate potential changes in monetary policy.