


Persistently high inflation data from New Zealand boosted NZD earlier today.
Does this mean that AUD/NZD’s short-term rally is over?
Before moving on, ICYMI, yesterday’s watchlist checked out CAD/CHF’s possible Double Bottom pattern ahead of Canada’s CPI reports. Be sure to check out if it’s still a good play!
And now for the headlines that rocked the markets in the last trading sessions:
Fresh Market Headlines & Economic Data:
BOJ Governor Kazuo Ueda hinted of extended ultra-loose policies, saying that “our overall narrative on monetary policy remains unchanged” if the prospect of sustained 2% inflation remains distant
Canada CPI for June 2032: 2.8% y/y (3.0% y/y forecast; 3.4% y/y previous); led by falling energy costs to a 27-month low; core CPI fell to 3.2% y/y (3.6% y/y forecast) vs. 3.7% y/y previous
Canada Industrial Product Price Index for June: -0.6% m/m (0.1% m/m forecast; -0.6% m/m previous; Raw Materials Price Index was -1.5% m/m (-0.4% m/m forecast; -5.0% m/m previous)
Canada housing starts in June: 281K (200K forecast/previous)
U.S. Retail Sales for June: 0.2% m/m (0.3% m/m forecast; 0.5% m/m previous); core Retail Sales were inline with expectations at 0.2% m/m (0.3% m/m previous)
U.S Industrial Production in June: -0.4% y/y (0.5% y/y forecast; 0.2% y/y previous)
NAHB Housing Market Index ticked up in July to 56 vs. 55; “The lack of resale inventory means prospective home buyers who have not been priced out of the market continue to seek out new construction in greater numbers”
All major US stock indices finished higher, at levels not seen since early April 2022, thanks to stronger-than-expected earnings reports and another AI-related rally
The Conference Board Leading Economic Index for Australia grew by 0.1% m/m in May after a 0.3% downtick in April
AU MI leading index improved from -1.01% to -0.51% in June. Expectations of a prolonged RBA rate hike pause helped, while subdued growth outlook dragged.
New Zealand’s CPI up by 1.1% q/q in Q2 2023 vs. 1.2% in Q1, 0.9% expected. Annual CPI dropped from 6.7% to 6.0% in Q2 thanks to lower petrol prices and higher interest rates
Falling fuel prices dragged the U.K.’s consumer prices from 8.7% y/y to 7.9% y/y in June. Core CPI also eased from 7.1% y/y to 6.9% y/y
U.K.’s factory gate prices eased from 2.7% y/y in May to 0.1% in June, the lowest rate since December 2020
Price Action News
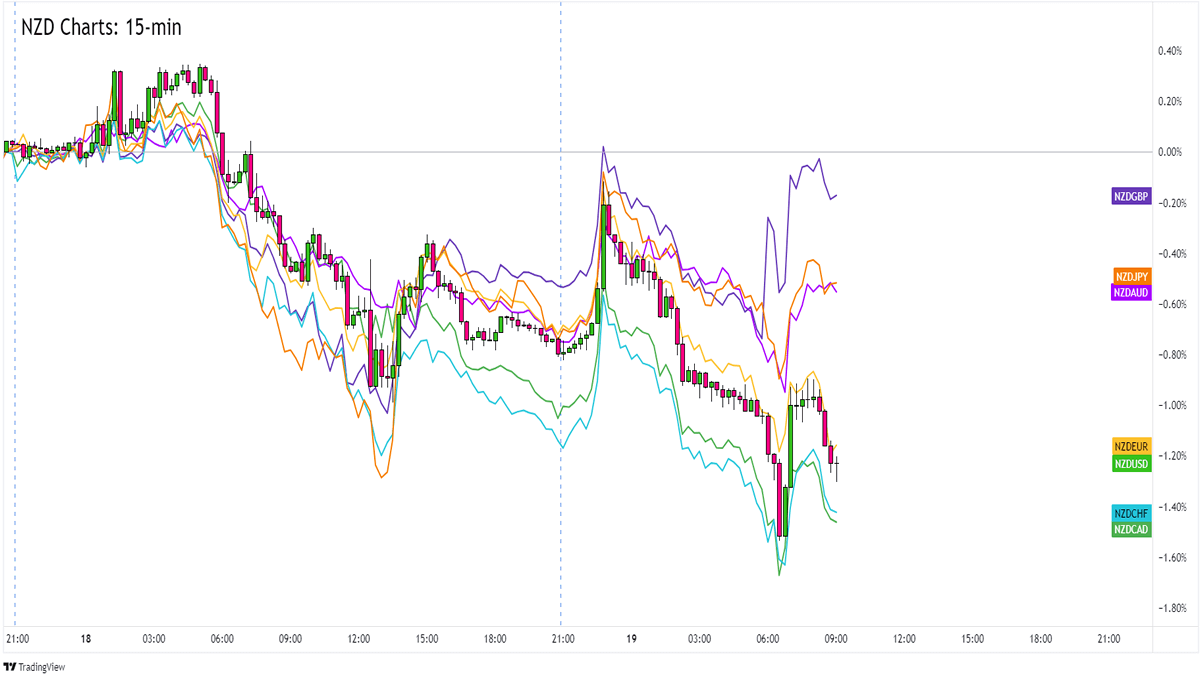
Overlay of NZD Pairs 15-min
Data printed earlier showed New Zealand’s consumer prices rising at a much slower rate in Q2 compared to the previous quarter.
New Zealand’s CPI remains way above the RBNZ’s target range, however, so much so that traders still believe that the RBNZ won’t be done with tightening its monetary policies for a while yet.
NZD popped higher at the CPI release before Asian session traders took over. Turned out, investors are worrying that China’s economic numbers haven’t deteriorated enough to inspire meaningful stimulus from the government.
Kiwi extended its intraweek downtrend before the start of the European session where a weaker-than-expected U.K. CPI report encouraged a bit of risk-taking.
Upcoming Potential Catalysts on the Forex Economic Calendar:
U.S. housing starts at 12:30 pm GMT
EIA crude oil inventories at 2:30 pm GMT
Japan’s trade balance at 11:50 pm GMT
Australia’s labor market data at 1:30 am GMT (July 20)
Australia’s quarterly NAB business confidence at 1:30 am GMT (July 20)
Use our new Currency Heat Map to quickly see a visual overview of the forex market’s price action! 🔥 🗺️
AUD/NZD: 15-min
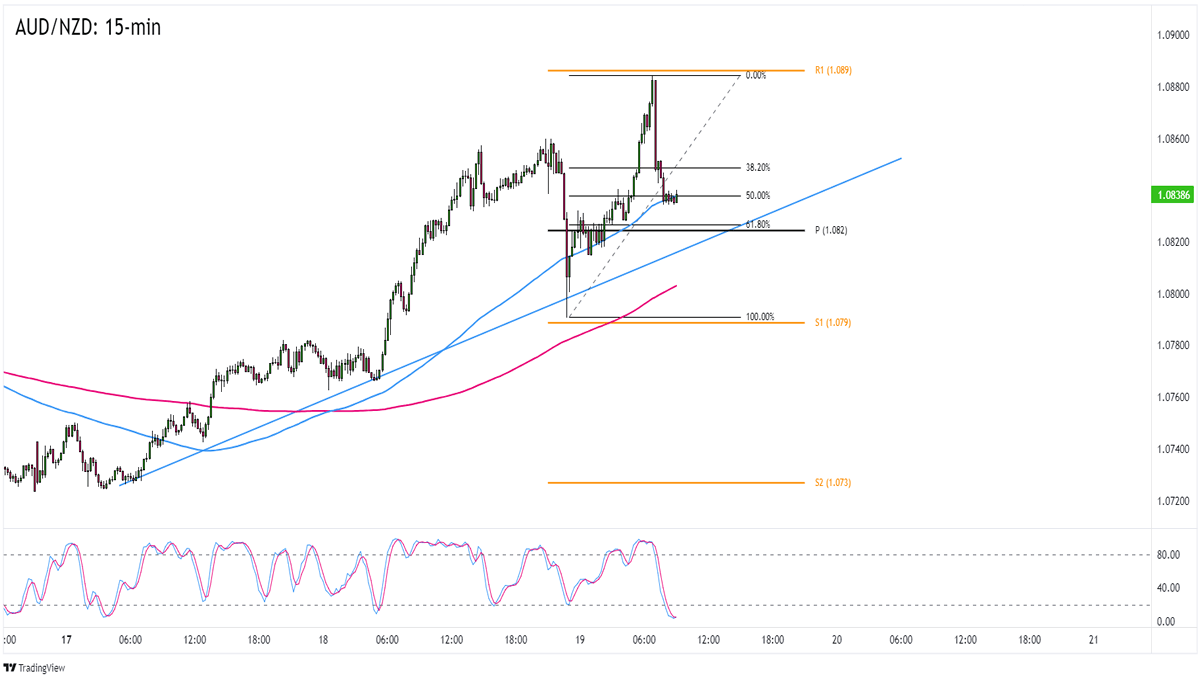
AUD/NZD 15-min Forex Chart by TV
Are comdolls volatile or what!
Thanks to growth concerns and data releases from both Australia and New Zealand, AUD/NZD has seen its fair share of volatility this week.
The pair hit a high at 1.0880 before pullback back to the 1.0840 zone near a trend line and 50% Fibonacci support.
Will AUD/NZD’s rejection at 1.0880 mean that the short-term uptrend is over? Or are the bulls just taking a breather?I’ll be looking closely at the current consolidation near the 100 SMA, which could lead to a bounce back to AUD/NZD’s intraweek highs.
Australia’s labor market data scheduled during the Asian session could make or break AUD/NZD’s short-term uptrend.
Markets see Australia printing fewer net job additions in June, which could drag AUD/NZD to the 1.0820 Pivot Point line.
If Australia prints better-than-expected numbers, or if global growth concerns hit NZD harder than AUD this week, then AUD/NZD could revisit the 1.0880 zone.
Keep close tabs on this one!