


Did anyone else notice NZD rising like crazy against CAD?
NZD/CAD is now testing a key resistance zone after this week’s moves!
Let me show you the setup on the daily chart:
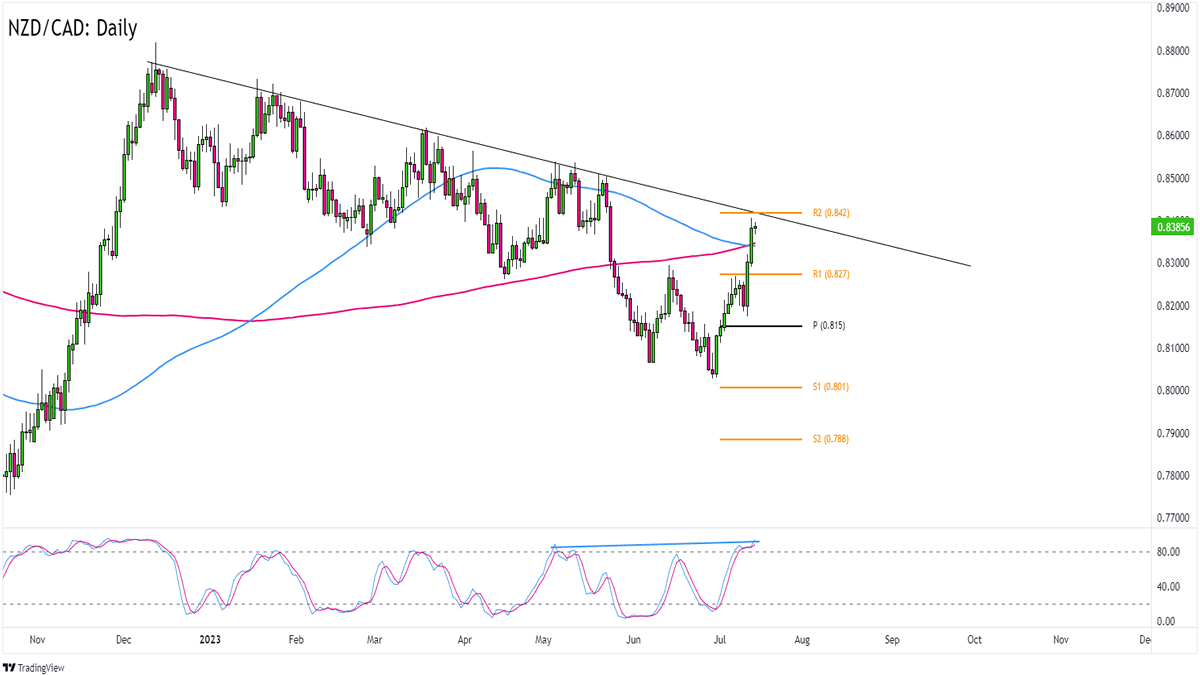
NZD/CAD: Daily
NZD/CAD Daily Forex Chart by TV
July has been a good month for NZD against CAD, as NZD/CAD has risen by a whopping 340ish pips since the month started.
A huge chunk of the move happened this week with NZD/CAD poppin’ up from the .8200 psychological handle to test the .8400 area of interest.
As you can see, .8400 is not too far from the R2 (.8420) of the Pivot Points as well as a trend line resistance that’s been around since December 2022. The area is even near a potential bearish SMA crossover on the daily time frame!The cherry on top of this sweet setup is a potential bearish divergence on the chart.
Think NZD/CAD will get rejected at the trend line resistance?
You can short at current levels or wait for a bearish momentum before aiming for previous lows like .8200 or .8050.
Before you sell NZD/CAD like there’s no tomorrow, though, you have to know that the last two candlesticks are unmistakably bullish. NZD/CAD’s bullish momentum could still have legs and may even attempt to break above the resistance zone that we’ve marked.
If you’re one of them NZD/CAD bulls, then you can also wait for a clear break above the trend line and then aim for previous inflection points like .8500 or .8550.