


Missed the range breakout on WTI crude oil?
You might still have a chance at catching the rally on this quick pullback!
Let me show you the setup on the 4-hour time frame.
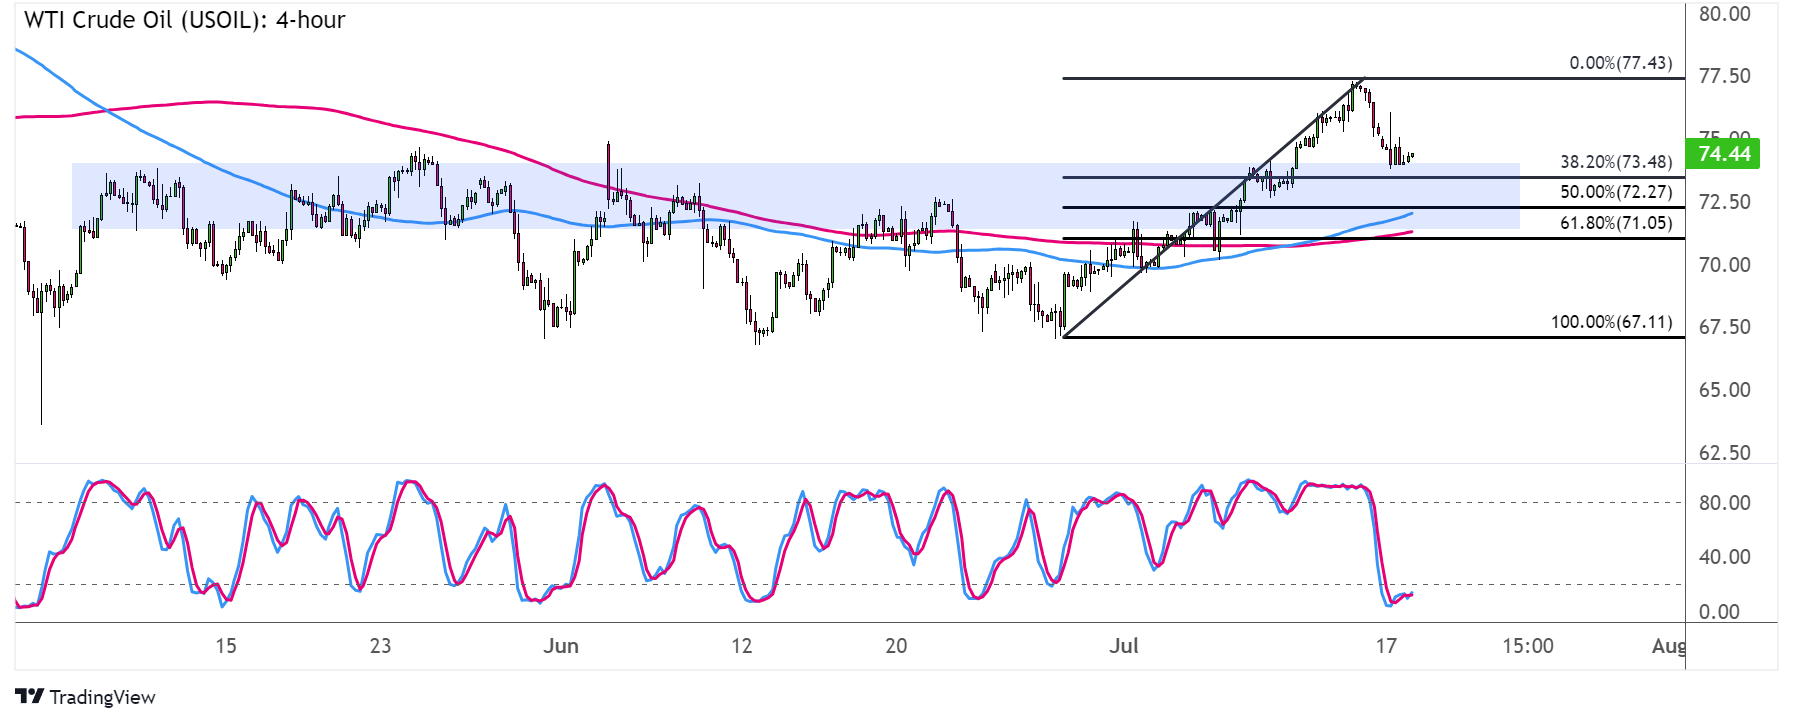
WTI Crude Oil (USOIL): 4-hour
WTI Crude Oil (USOIL) 4-hour Chart by TV
Crude oil managed to bust out of its range resistance around the $73.50 per barrel mark last week!
Price hit a ceiling near $77.50 per barrel and is now pulling back to the nearby support zones. The Fib retracement tool shows where more buyers might be waiting to hop in.In particular, the 38.2% level is at $73.48 per barrel, which might be enough to keep losses in check. If so, crude oil could make its way back up to the swing high and beyond.
After all, Stochastic is already indicating oversold conditions or exhaustion among sellers. The oscillator looks ready to turn higher, suggesting a potential return in bullish pressure soon.
Also, the 100 SMA is above the 200 SMA to confirm that support levels are more likely to hold than to break. The moving averages are close to the 61.8% Fib at $71.05 per barrel to add to its strength as a floor.
However, a break below this area would put the commodity back inside its range, possibly even spurring a move back to the bottom at $67.11 per barrel.
Weak Chinese GDP data seems to be weighing on risk-on vibes so far this week, so crude oil might be on the back foot. Still, other top-tier economic catalysts like the U.S. retail sales or inflation data from the U.K. and New Zealand might influence broad market sentiment, so watch out!