


This precious metal is testing a key support-turned-resistance zone once more!
Will it keep holding this time?
Here’s what I’m looking at on the 4-hour time frame.
Gold (XAU/USD): 4-hour
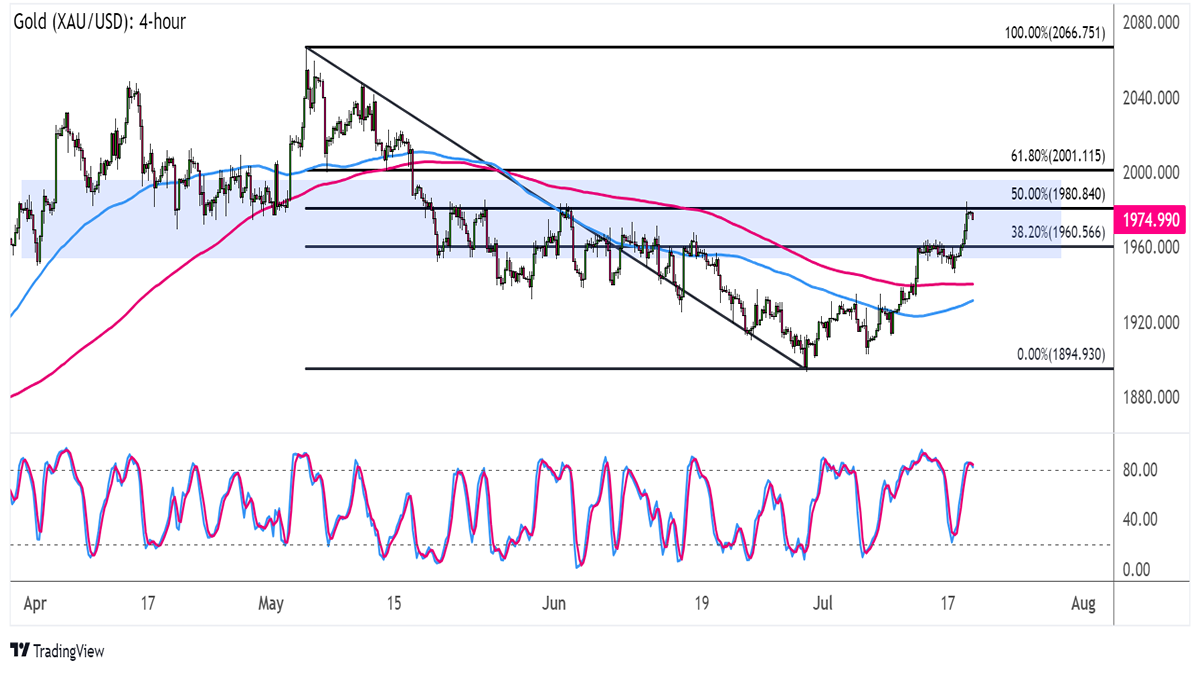
Gold (XAU/USD) 4-hour Chart by TV
This safe-haven commodity has been climbing steadily so far this month, but it looks like the rally is hitting a roadblock at the $2,000 barrier.
Now this area of interest is spanned by the 50% to 61.8% Fibonacci retracement levels, which might be enough to keep gains in check and send gold back down to the swing low near $1,900.After all, technical indicators are hinting that resistance levels are more likely to hold than to break. The 100 SMA is below the 200 SMA to reflect bearish pressure while Stochastic just reached the overbought zone to signal exhaustion among buyers.
Then again, gold is trading above both moving averages, so these could hold as dynamic support on dips. Also, the gap between the indicators is narrowing to signal a possible bullish crossover.
In that case, price might be able to bust through the $2,000 mark and go for a rally all the way up to its swing high at $2,066!
Risk-off vibes might be enough to keep this safe-haven asset afloat in the next few days, especially as market junkies stay wary of global recession risks stemming from China’s weak economic performance.
Where do you think gold is headed from here?