


Check out this neat confluence on the 4-hour time frame of GBP/USD!
Do you think the uptrend is bound to resume soon?
Here are the technical signals I’m keeping tabs on.
GBP/USD: 4-hour
GBP/USD 4-hour Forex Chart by TV
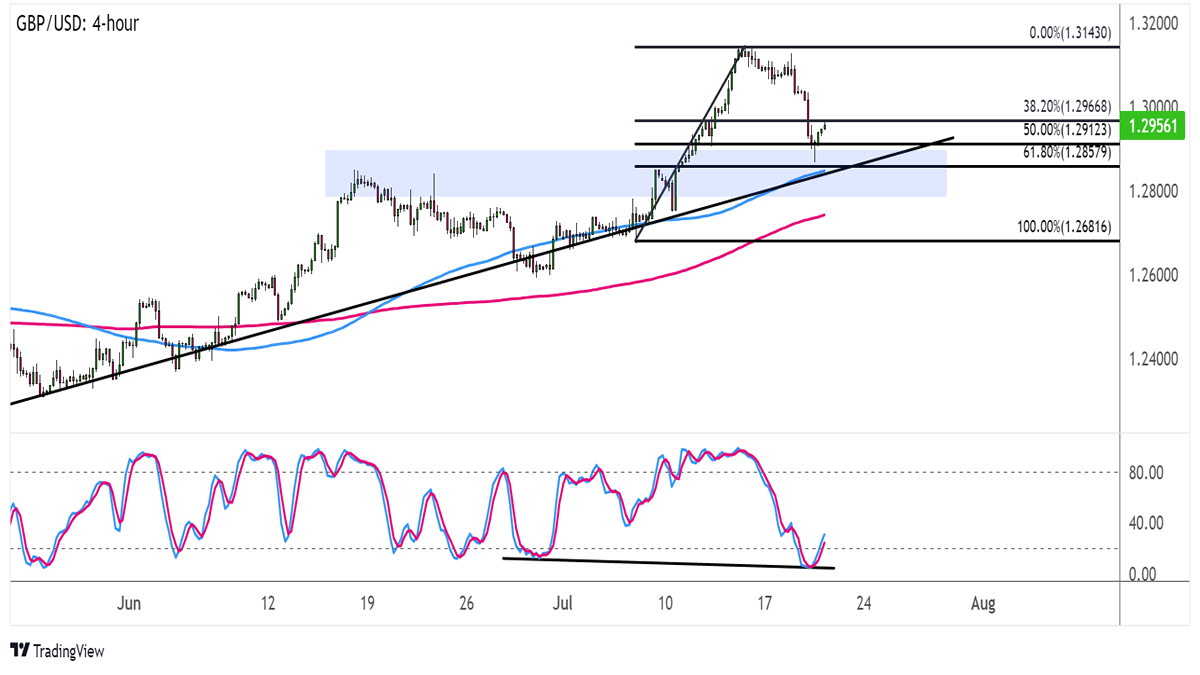
Cable has been cruising with higher lows connected by an ascending trend line that’s been holding since last month.
The pair is back in correction mode and looks ready to test this support zone, which happens to be in line with the 61.8% Fibonacci retracement level.To top it off, the area of interest coincides with a former resistance area around the 1.2850 minor psychological mark plus the 100 SMA dynamic support, too!
This faster-moving SMA is above the 200 SMA to confirm that the uptrend is more likely to resume than to reverse. At the same time, Stochastic is pulling up from the oversold region to indicate a return in bullish pressure.
I’m also spotting a bullish divergence, as the oscillator formed lower lows while price had higher lows. Stochastic has plenty of room to climb before reaching the overbought area, so GBP/USD might be able to climb to the swing high at 1.3143 and beyond.
Inflation data from the U.K. turned out weaker than expected, though, so there could be a chance the BOE considers pausing its aggressive tightening cycle. Then again, things aren’t lookin’ too good for the U.S. economy either, as the June retail sales report came in below expectations as well.
The U.K. retail sales is still up for release later this week, so GBP/USD could be in for additional volatility then!