


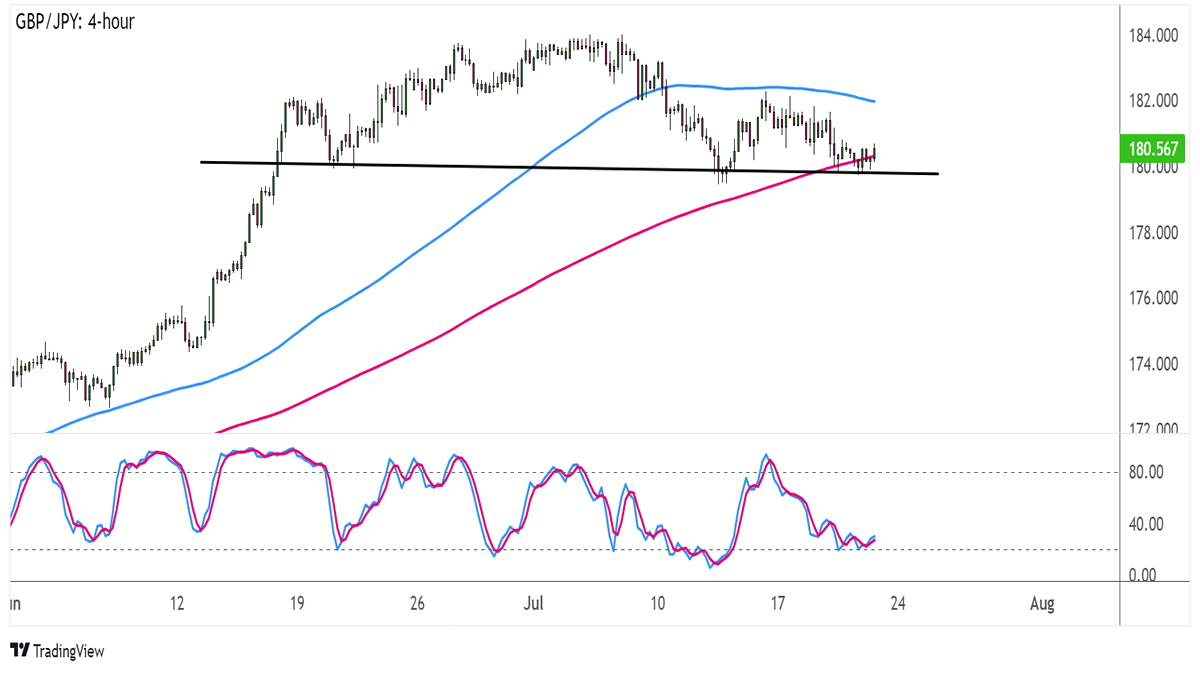
Is that a head and shoulders formation I’m seeing on the 4-hour chart of Guppy?
It looks like the pair is gearing up to break below its neckline support pretty soon!
Here are the levels you should keep tabs on.
GBP/JPY: 4-hour
GBP/JPY 4-hour Forex Chart by TV
Price is already testing the support around the 180.00-180.50 zone, and a break below this could set off a drop that’s the same height as the chart pattern.
That’d be roughly 400 pips yo!
Technical indicators aren’t looking so convinced yet, though. Stochastic appears to be pulling higher without even reaching the oversold region, suggesting that buyers are eager to return.Also, the 100 SMA is still above the 200 SMA, which means that the path of least resistance is to the upside.
In other words, there’s a chance support could hold and send GBP/JPY back up to the next area of interest at 182.00. Note that the 200 SMA dynamic inflection point even lines up with the neckline to add to its strength as a floor.
Then again, the gap between the moving averages is narrowing to reflect slowing bullish momentum and a potential bearish crossover.
Earlier this week, the U.K. printed weaker than expected CPI figures, possibly dampening BOE tightening bets in the near-term.
Better keep your eyes peeled for the U.K. retail sales report coming up before the end of this week if you’re trading this one!