


After a rocky start, our price strategy discussions did arguably well, upping the odds for great trading outcomes during a busy forex calendar! How were you able to navigate this week’s top tier events?
AUD/CAD: Monday – July 10, 2023
AUD/CAD 2-Hour Forex Chart by TV
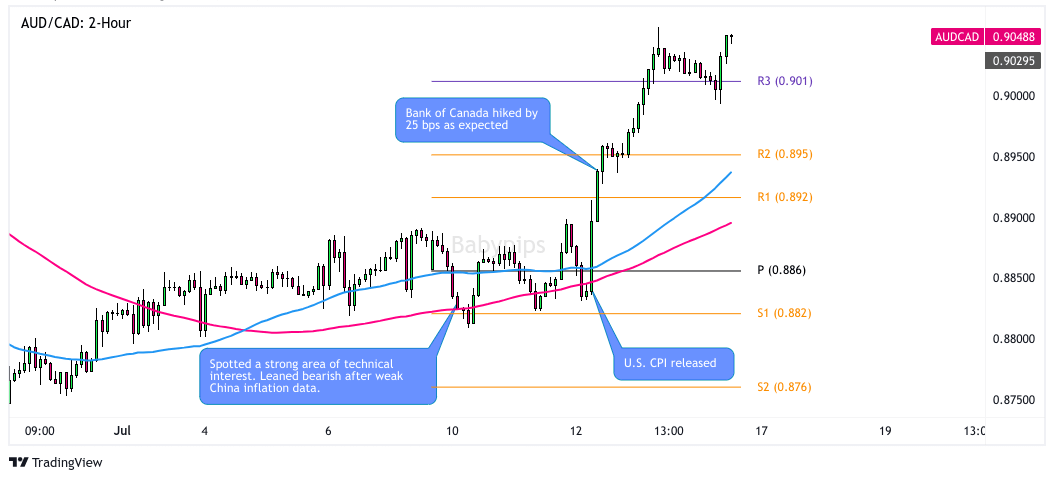
On Monday, we saw a big dip in the Australian dollar during the Asia session, likely a reaction to the slower-than-expected inflation updates from China. The argument there is that slowing inflation may be a signal of slowing economic conditions in China, one of the biggest trade partners with Australia.
We also saw that the market was testing a solid technical setup on AUD/CAD that could draw in buyers around the 200SMA and double top neckline, but we were leaning more towards a short setup given the Aussie reaction and the possibility of the Loonie drawing buyers ahead of the BOC meeting this week.
We thought that IF the market did a sustained break below the technical area discussed above, that may draw in enough sellers to take the pair lower to .8760 or beyond. Unfortunately for our short bias lean, that area did hold as support and eventually drew in buyers.
Risk sentiment shifted positively after another tick lower in U.S. CPI on Wednesday, prompting traders to price in lower odds of Fed rate hikes. The Canadian dollar actually fell hard with the U.S. CPI release, and then fell further after the Bank of Canada’s expected 25 bps rate hike, likely a “buy-the-rumor, sell-the-news” scenario. Also, this reaction may have been a signal that the rhetoric from the BOC on fighting inflation was likely seen as only slightly hawkish in many traders eyes.
AUD/CAD broke the consolidation pattern to the upside on Wednesday, leading to a strong rally into the Friday session. For those who did take the long technical arguments discussed, congrats on a likely big win. And for those who leaned bearish with us, good risk management likely kept losses small.
NZD/CHF: Tuesday – July 11, 2023
NZD/CHF 2-Hour Forex Chart by TV
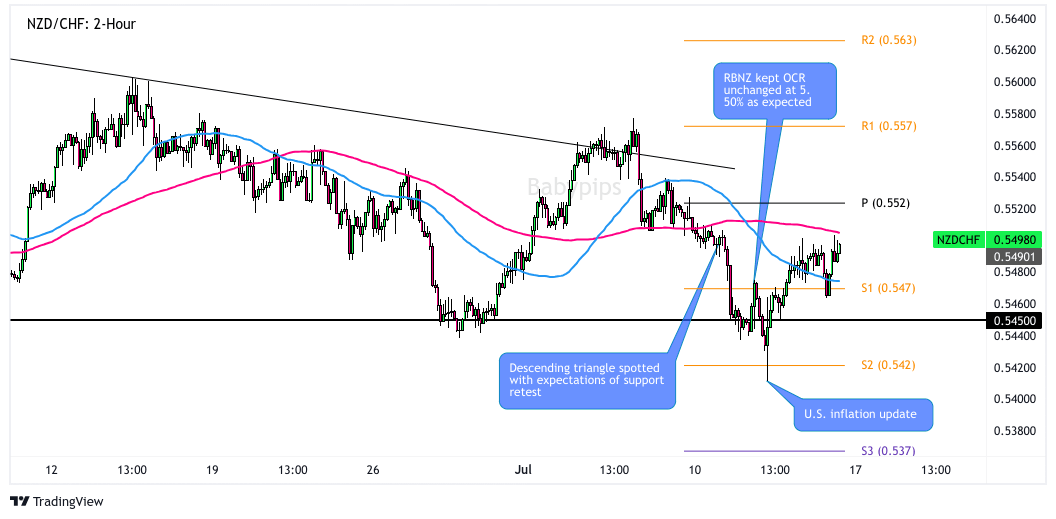
On Tuesday, we spotted a descending triangle developing on NZD/CHF, a solid pattern to watch ahead of the upcoming monetary policy statement from the Reserve Bank of New Zealand.
Based on market expectations, the RBNZ was expected to hold the OCR at 5.50% given signs of weakness in economic growth and a possible peak in the unprecedented rise in inflation rates.
With that outlook we leaned short-term bearish on NZD/CHF and thought it could make it to the support area of the descending triangle. From there, we thought a bounce was possible on a potential “buy-the-rumor, sell-the-news scenario” after the RBNZ monetary policy statement.
Looking back, it looks like that scenario played out pretty closely with NZD/CHF eventually retesting the triangle support area, but not bottoming out until testing the S2 Pivot area. From there, the market made its way back higher, likely with the help of the broad shift in risk sentiment towards positive after the U.S. inflation updates.
So, playing the discussed strategy gave us both short and long opportunities, and a likely positive outcome if risk managed well.
EUR/CAD: Wednesday – July 12, 2023
EUR/CAD 2-Hour Forex Chart by TV
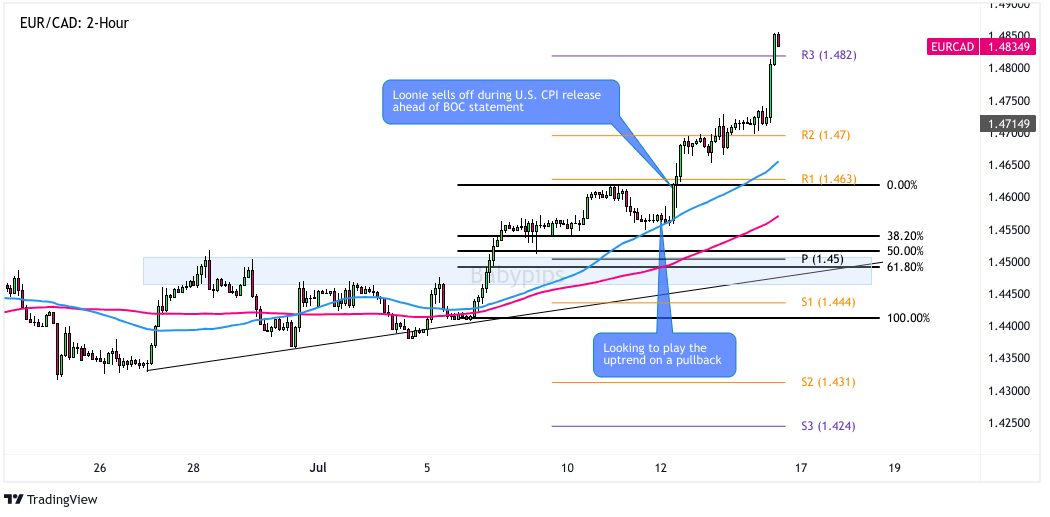
With the latest monetary policy statement from the Bank of Canada fast approaching, we decided that the uptrend in EUR/CAD was one to watch. With odds of volatility rising for the Loonie, and priced-in expectations of a 25 bps hike by the BOC, our sights were on a retest of the rising lows pattern to potentially play a bullish move if buying support appeared.
Unfortunately for CAD bears looking for a pullback, the Loonie sold off quickly ahead of the BOC statement, correlating with the U.S. CPI release. Not exactly sure of the connection there, but possibly because of the geographical and trade closeness of the U.S. and Canada, some traders may have taken the U.S. CPI as a signal of similar inflation condition developments ahead for Canada.
Whatever the case may be for the big spike in CAD selling, it was enough to not only push EUR/CAD higher, but also spark a big momentum move well beyond the R3 Pivot level.
For those looking for a pullback like us, the move was likely missed. But for those who risk managed differently, like a scaled entry approach at market, you likely did very well this week on EUR/CAD.
USD/JPY: Thursday – July 13, 2023
USD/JPY 30-min Forex Chart by TV
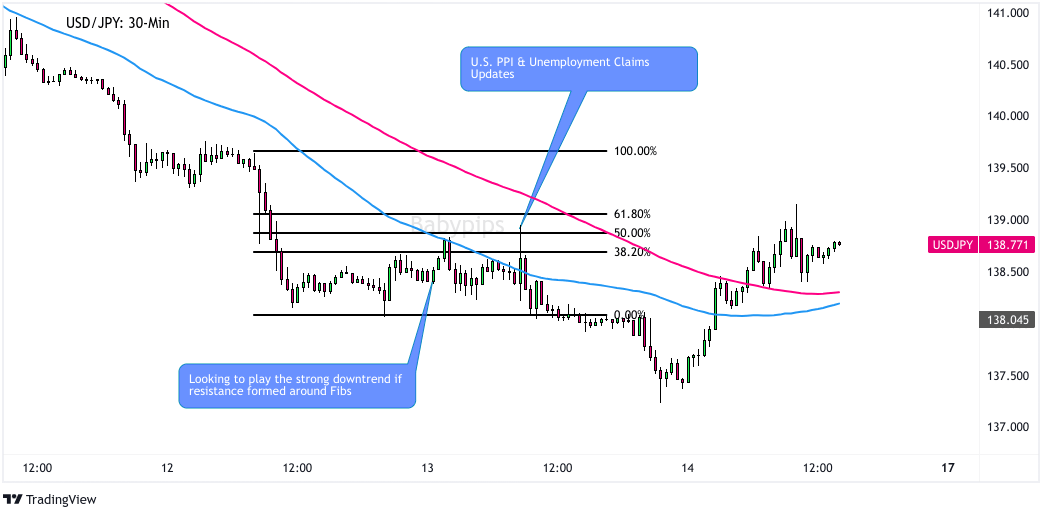
On Thursday, we took a look at the strong downtrend in USD/JPY, mainly driven by the rapidly rising bearish sentiment on the U.S. dollar. We thought that the upcoming U.S. PPI could bring in volatility and more USD sellers if it also pointed to falling inflation rates.
The technical picture was pretty bearish as well with the market trading below the 100 and 200 SMA’s and forming a lower ‘highs’ pattern in the process. We also used the Fibonacci retracement tool to see areas where trend traders may jump in if the pair bounced on the session.
Our idea was to wait for the PPI report, and if we saw more signs of falling inflationary pressures, the trend lower could not only draw in technical traders on a bounce, but fundamental sellers as well.
It looks like that strategy had good odds of working out well as the market did pop up to the Fibonacci retracement area, finding resistance quickly around the 50% Fibonacci retracement area. This brought sellers back in control quickly and took USD/JPY down the 137.25 area before finding buyers during the Friday Asia session.
Congrats to those who were able to risk manage this strategy into a profitable outcome!
This content is strictly for informational purposes only and does not constitute as investment advice. Trading any financial market involves risk. Please read our Risk Disclosure to make sure you understand the risks involved.