


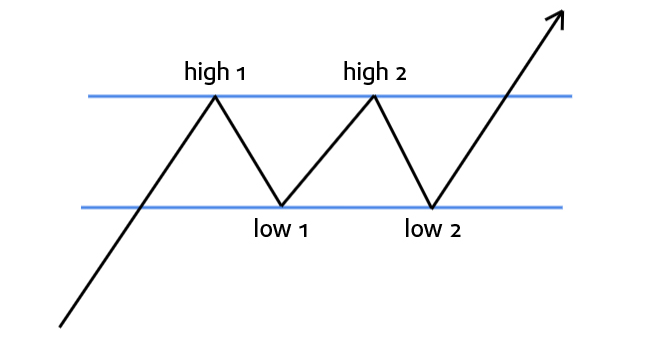
A Rectangle is a chart pattern that features two horizontal trend lines that act as well-defined support and resistance levels
Each trend line needs to contain at least two tops or bottoms.
Rectangles are known as consolidation patterns that indicate that a war is raging between bulls and bears. Price has consolidated into a range.

In the example above, we can clearly see that the pair was bounded by two key price levels which are parallel to one another.
While other chart patterns typically are drawn with diagonal or sloping trend lines, a Rectangle is formed with support and resistance levels that are drawn with horizontal or flat trend lines.
In real life, the trend lines might not be perfectly flat and have a slight slope.
The Rectangle can be either a continuation or a reversal chart pattern.
As a reversal pattern, it ends a trend and price moves in the other direction.
As a continuation pattern, it indicates a pause in the current trend, with the expectation that the trend will eventually continue.
Odds of reversal or continuation in a downtrend are about the same, but in an uptrend, the continuation scenario is more probable.
The support and resistance levels have to be hit several times and depending on the distance between them, you can sell when the price hits the resistance and buy when it hits the support.
When the price breaks out of a Rectangle, it is usually harder to interpret since it is uncertain in which direction price will move.
The Rectangle is most likely to continue the existing trend, but if it doesn’t, then look for the price to re-enter the Rectangle and start trading sideways again or break out of the other side.
Rectangles that form at the top or the bottom of a trend usually end up becoming a reversal chart pattern like a Double Top, Double Bottom, Triple Top, or Triple Bottom.
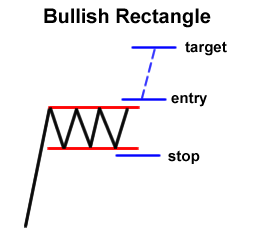
If the Rectangle continues to follow an uptrend, with breakout occurring on the upside, then the rectangle is referred to as bullish.
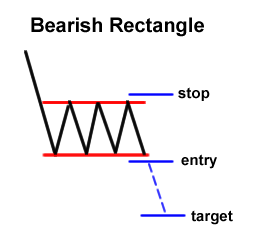
If the Rectangle continues to follow a downtrend, with breakout occurring on the downside, then the rectangle is referred to as bearish.
In both uptrends and downtrends, volume is more likely to fall as the pattern completes its formation