


A Simple Moving Average (SMA) is a technical indicator that shows the average price of an asset over a specific period of time.
It is calculated by taking a series of prices that are added together and then dividing the total by the number of data points.
For example, if the most recent three prices are 1, 2, 3, then the average would be the sum of the prices (1+2+3) divided by the number of reporting periods.
The sum of the prices is 6 and the number of reporting periods is 3, so 6 divided by 3 equals 2.
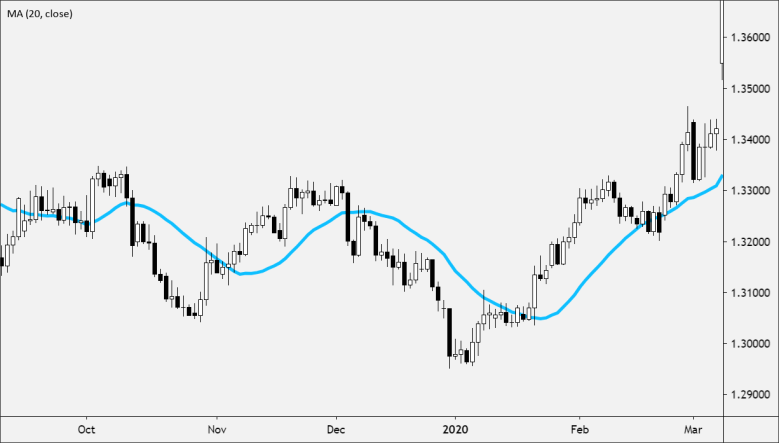
The SMA is called a “moving average” because it is plotted on the chart with each bar, forming a line that “moves” along with the chart as the average price changes.
Each time a new price becomes available, the average “moves” so that the average is always based only on the last same number of reporting periods.
Using a Simple Moving Average helps to reduce the noise of fluctuating prices in order to determine the overall trend direction.
How to Use the Simple Moving Average (SMA)
SMAs are used to smooth price data.
The longer the period of the SMA, the smoother the result. But the longer, the period of the SMA< the more lag exists between the SMA and the actual price.
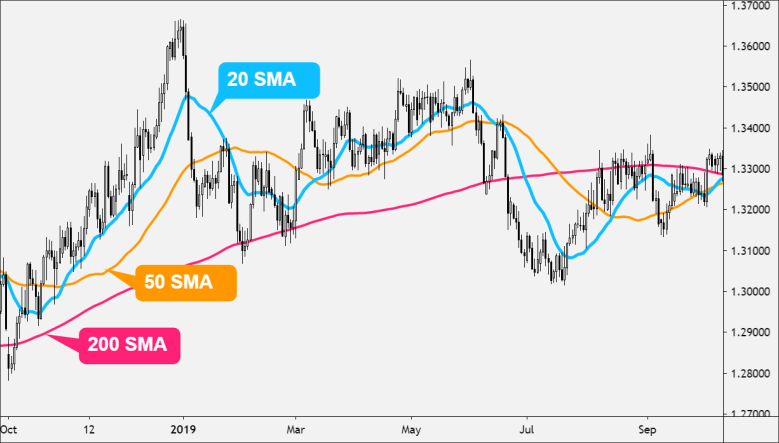
SMAs are used to identify trend direction.
- If the SMA is moving up, the trend is up.
- If the SMA is moving down, the trend is down.
- A 200-period SMA is used to determine the long term trend.
- A 50-period SMA is used to determine the intermediate trend.
- A 5, 10, or 20-period SMA are used to determine the shorter-term trend.
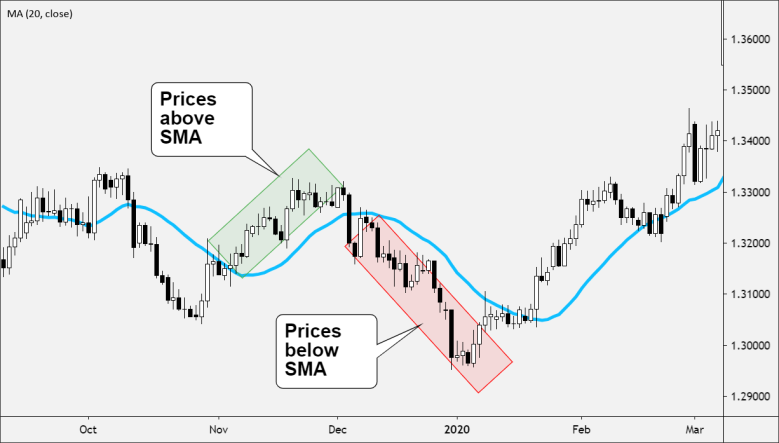
When price crosses above or below an SMA…
- When the price cross above the SMA, it indicates that the price is trending upwards as it is rising at a faster rate than the moving average. This is considered bullish.
- When the price crosses below the SMA, it indicates that the price is trending downwards as it is falling at a faster rate than the moving average. This is considered bearish.
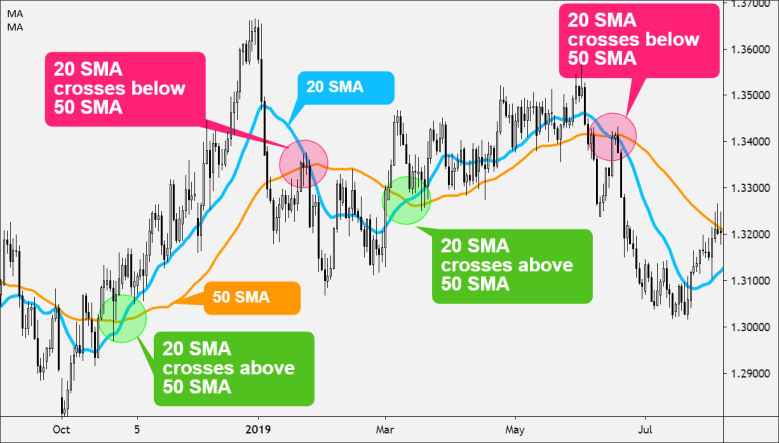
When an SMA crosses above or below another SMA…
- Place two Simple Moving Averages (SMAs) on the same price chart.
- Typically, the “faster” moving average which consists of fewer data points will be selected, as well as a “slower “moving average.
- When the faster moving average crosses above the slower moving average, this is considered a buy signal.
- When the faster moving average crosses below the slower moving average, this s considered a sell signal.
How to Calculate Simple Moving Average (SMA)
Unlike the WMA or EMA, the SMA is simply the mean, or average, of the price values over a specified period.
SMA = (A1 + A2 + ……….An) / n
Where:
A = average in period n
n n is the number of periods