


Global growth and high interest rate concerns dragged the New Zealand dollar to the bottom of the forex heap this week.
Meanwhile, strong U.S. data inspired hawkish Fed bets and pushed the U.S. dollar higher across the board.
Missed the major forex headlines? Here’s what you need to know about last week’s FX scene:
USD Pairs

Overlay of USD vs. Major Currencies Chart by TV
Anti-risk global growth concerns and pro-risk “peak Fed interest rate” speculations following the previous week’s slow U.S. CPI reading kept the U.S. dollar in tight ranges in the first half of the week.
The Greenback started gaining more consistently across the board as the U.S. and other major economies printed strong enough economic reports to support longer periods of high interest rates if not even more rate hikes from the major central banks.
USD gained the most against JPY and high-yielding bets like NZD, AUD, and GBP and saw weak gains/small losses against CHF and CAD.
🟢 Bullish Headline Arguments
NY Manufacturing Index for July: 1.1 (-6.0 forecast; 6.6 previous); employees index popped to 4.7 from -3.6 previous; prices paid index fell to 16.7 vs. 22.0 previous
Retail Sales for June: 0.2% m/m (0.3% m/m forecast; 0.5% m/m previous); core retail sales was inline with expectations at 0.2% m/m (0.3% m/m previous)
NAHB Housing Market Index ticked up in July to 56 vs. 55; “The lack of resale inventory means prospective home buyers who have not been priced out of the market continue to seek out new construction in greater numbers”
Initial jobless claims for the week ending July 15: 228K (242K forecast; 237K previous); the less volatile four-week moving average also fell 9.25K to 237.5K
Philly Fed Manufacturing Index for July: -13.5 vs. -13.7 in June
🔴 Bearish Headline Arguments
Industrial Production in June: -0.4% y/y (0.5% y/y forecast; 0.2% y/y previous)
Building Permits for June : 1.44M (1.46M forecast; previous revised higher to 1.5M); home starts fell by -8.0% m/m but better than expected and still at pre-pandemic levels.
Existing Home Sales for June: -3.3% m/m (-1.2% m/m forecast; 0.2% m/m previous); the downturn is mainly due to extremely low inventory of pre-owned homes
EUR Pairs
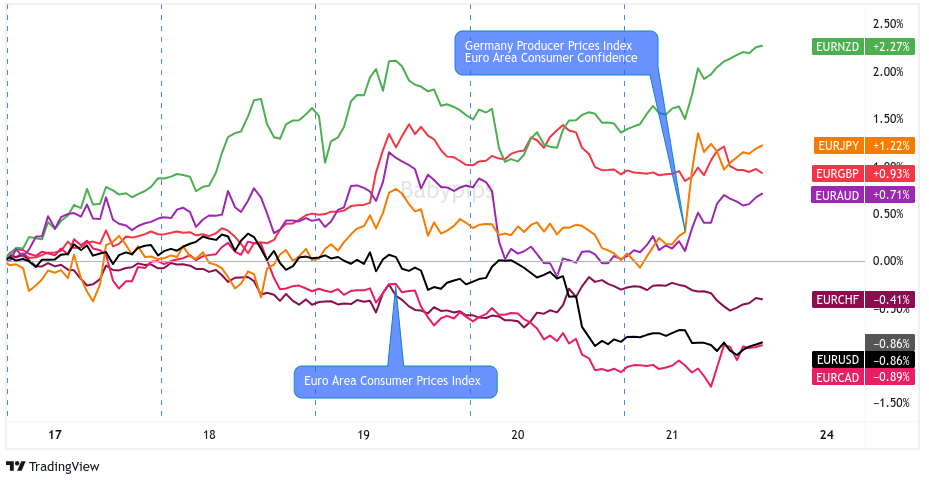
Overlay of EUR vs. Major Currencies Chart by TV
There were not a lot of catalysts to cause a re-pricing of ECB rate hike expectations, so the euro behaved more as a countercurrency outside of small Eurozone data-related spikes.
ECB Governor Council member Klaas Knot did help EUR some on Tuesday when he hinted that a September rate hike is not a done deal.
The common currency saw the most gains against NZD, JPY, GBP, and AUD but lost to CHF, USD, and CAD.
🟢 Bullish Headline Arguments
ECB Governing Council member Klaas Knot said monetary tightening beyond next week’s meeting is anything but guaranteed — suggesting officials could soon pause their unprecedented campaign of interest-rate hikes.
Euro-area annual inflation fell to 5.5% y/y in June 2023 as expected; core inflation strengthened to 5.5% y/y (5.4% y/y forecast; 5.3% y/y previous)
Germany’s producer prices edged up 0.1% y/y in June – the lowest since November 2020 – vs. 0.0% expected, 1.0% y/y in May
Euro Area Flash Consumer Confidence for July 2023 improved by 1 point to -15.1, continuing its slow recovery since 2022 low levels around -30
GBP Pairs
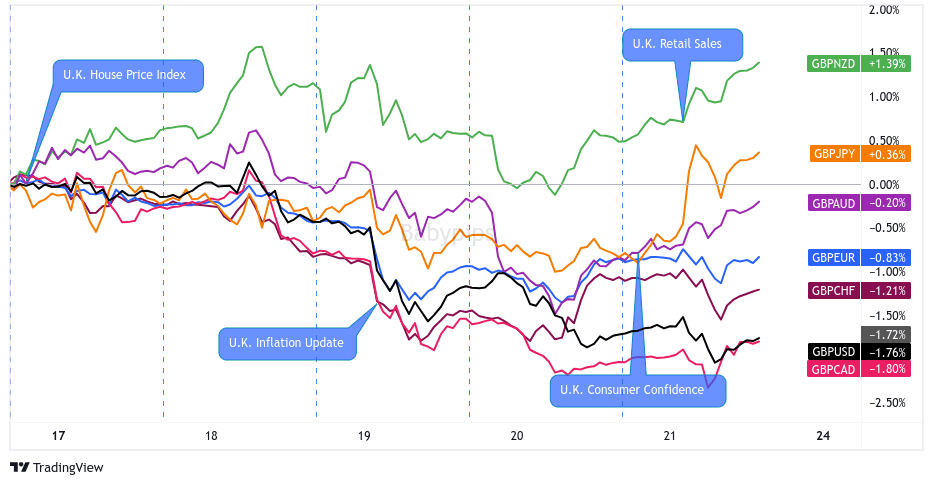
Overlay of GBP vs. Major Currencies Chart by TV
The British pound was trading in tight ranges and going along with risk sentiment when the U.K.’s CPI figures showed sharp slowdowns in June.
Talks of a less hawkish BOE dragged U.K.’s bond yields and lessened the demand for GBP in the second half of the week.
GBP looks set to end the week lower against its major counterparts with exception to the Kiwi and the yen.
🟢 Bullish Headline Arguments
Falling fuel prices dragged the U.K.’s consumer prices from 8.7% y/y to 7.9% y/y in June. Core CPI also eased from 7.1% y/y to 6.9% y/y.
Factory gate prices eased from 2.7% y/y in May to 0.1% in June, the lowest rate since December 2020
🔴 Bearish Headline Arguments
Retail sales for June: 0.7% m/m (0.1% m/m forecast/previous)
CHF Pairs
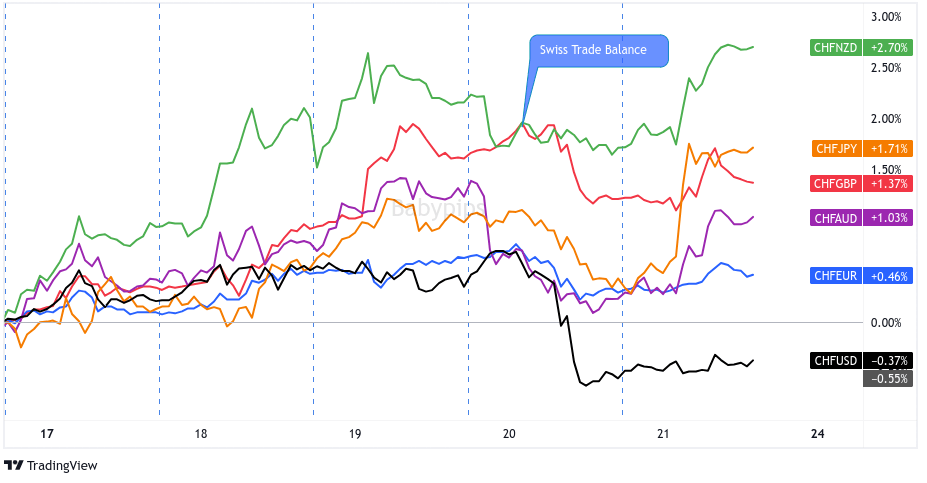
Overlay of CHF vs. Major Currencies Chart by TV
A lack of market-moving Swiss data releases meant that CHF mostly took its cues from overall risk sentiment and counter currency flows.
The Swiss franc’s safe-haven appeal helped it gain ground against “riskier” bets like NZD, GBP, AUD, EUR, and even CAD in the first half of the week.
CHF lost some of its intraweek gains, however, after strong data prints from the U.S. made the U.S. dollar more attractive as a safe haven against the higher-yielding currencies.
🔴 Bearish Headline Arguments
Trade surplus tightened from 4.4B CHF to 3.3B CHF in June as exports fell by 1.7% m/m while imports grew by 3.7%
AUD Pairs
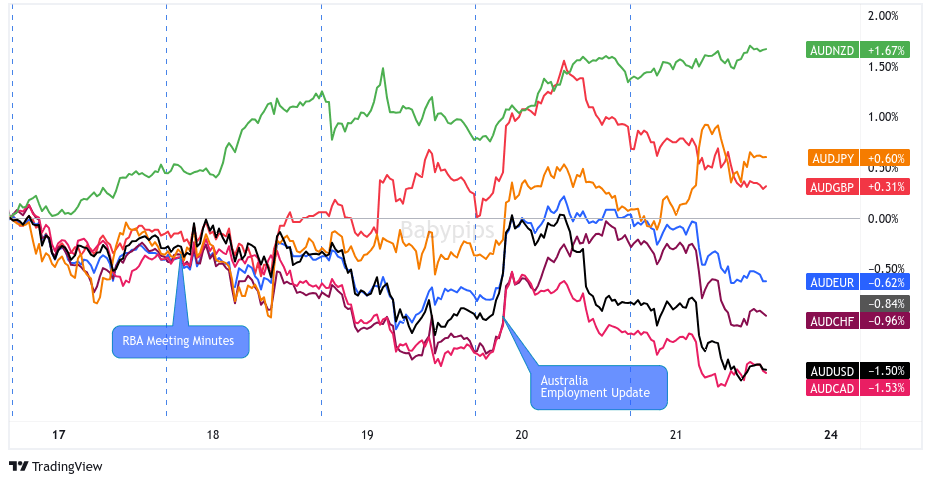
Overlay of AUD vs. Major Currencies Chart by TV
Chinese and global growth concerns dragged AUD to downtrends early in the week.
Luckily for AUD bulls, the RBA’s sorta hawkish meeting minutes and Australia’s surprisingly strong June labour data enabled the comdoll to recoup some of its intraweek losses.
Until the U.S. dropped its strong initial jobless claims report, that is.
Talks of the Fed having room to keep its rates high and maybe execute a couple more rate hikes weighed on risk assets like AUD, and the comdoll lost its gains against EUR, CHF, USD, and CAD.
🟢 Bullish Headline Arguments
China’s industrial production up by 4.4% y/y in June vs. 2.5% expected, 3.5% in May
China’s fixed asset investment increased by 3.8% ytd/y vs. 3.4% expected, 4.0% in May
RBA’s July meeting minutes showed that the Board agreed that “some further tightening may be required” and hints at revisiting the rate hike move at the August meeting
The Conference Board Leading Economic Index grew by 0.1% m/m in May after a 0.3% downtick in April
MI leading index improved from -1.01% to -0.51% in June. Expectations of a prolonged RBA rate hike pause helped, while subdued growth outlook dragged.
Australia added net 32.6K jobs in June vs. 15K expected, 76.6K previous. The unemployment rate dipped from 3.6% to 3.5% as the participation rate edged 0.1% lower to 66.8%
PBoC raised a parameter on cross-border corporate financing under its macro-prudential assessments (MPA) to 1.5 from 1.25, allowing companies to borrow more overseas in proportion to their assets
China’s National Development and Reform Commission Deputy Director Li Chunlin shared that two new policies for supporting non-state-owned businesses will be launched soon
Quarterly NAB survey showed business confidence rising 1pt to -3 while business conditions dropped 8 pts to +9 as businesses “moderated considerably” in Q2
🔴 Bearish Headline Arguments
China’s GDP grew by 0.8% in Q2 2023, slower than the 2.2% quarterly growth in Q1. Annual GDP came in at 6.3%, faster than Q1’s 4.5% uptick but slower than the 7.1% growth expected
China’s retail sales slowed down from 12.7% to 3.1% y/y in June
CAD Pairs
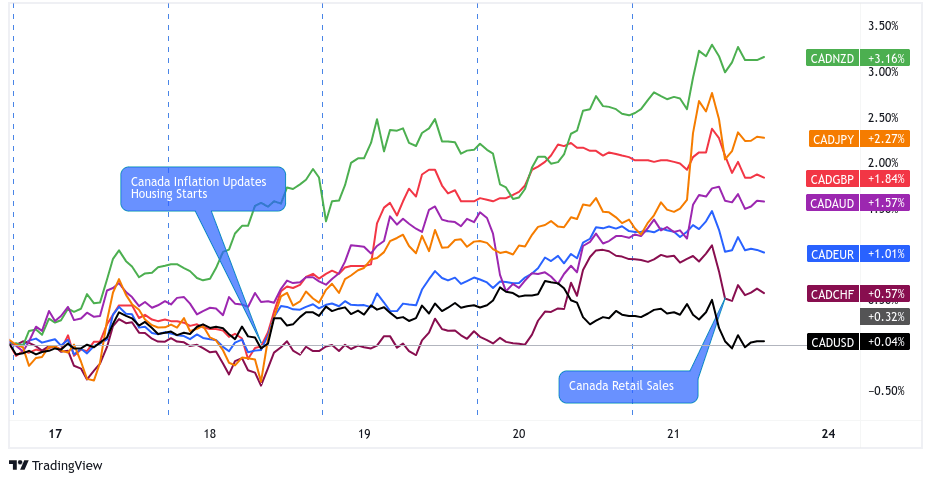
Overlay of CAD vs. Major Currencies Chart by TV
Risk aversion? Who she?
Thanks to net positive Canadian data releases and higher crude oil prices, CAD shrugged off most of the risk aversion vibes and traded higher against its major counterparts.
🟢 Bullish Headline Arguments
Foreign investment in Canadian securities for May: C$11.2B (-C$2.5B forecast; C$12.7B prevoius); “Canadian investors reduced their holdings of foreign securities by $2.8B in May, after acquiring $2.4B worth in April.”
Wholesale sales (excluding petroleum, petroleum products, and other hydrocarbons and excluding oilseed and grain) rose 3.5% as expected (vs. -1.4% previous) to C$83.6B in May.
CPI for June 2032: 2.8% y/y (3.0% y/y forecast; 3.4% y/y previous); led by falling energy costs to a 27-month low; core CPI fell to 3.2% y/y (3.6% y/y forecast) vs. 3.7% y/y previous
Industrial Product Price Index for June: -0.6% m/m (0.1% m/m forecast; -0.6% m/m previous; Raw Materials Price Index was -1.5% m/m (-0.4% m/m forecast; -5.0% m/m previous)
Housing starts in June: 281K (200K forecast/previous)
New Housing Price Index for June: 0.1% m/m (-0.1% m/m forecast; 0.1% m/m previous)
🔴 Bearish Headline Arguments
Retail sales for May 2023: 0.2% m/m (0.5% m/m forecast; 1.0% m/m previous); core retail sales was 0.0% m/m (0.3% m/m forecast; 1.2% m/m previous)
NZD Pairs
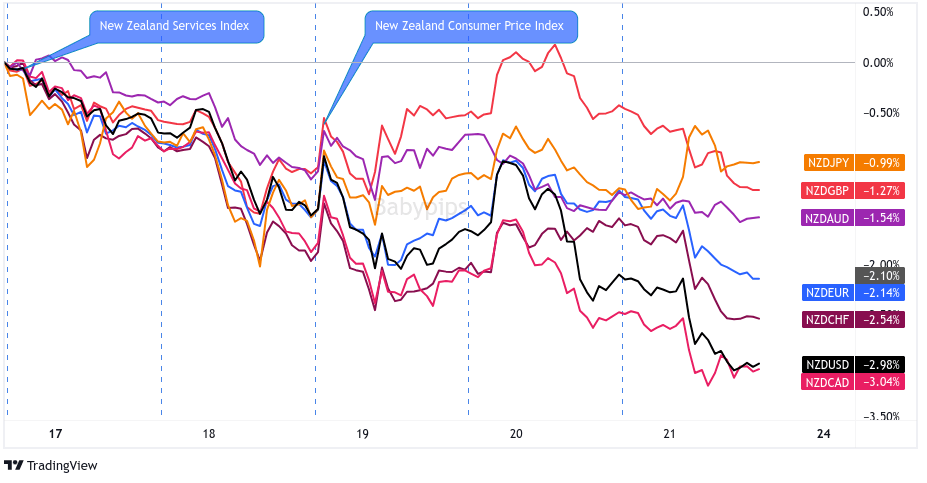
Overlay of NZD vs. Major Currencies Chart by TV
The New Zealand dollar was probably the biggest loser this week as profit-taking from the previous weeks’ gains got mixed in with overall risk aversion and other major central banks having more reasons to raise interest rates.
NZD saw a steady selling all week except for when New Zealand printed a still relatively high inflation update for Q2, Australia dropped a strong (hawkish) jobs report, and when China made moves to stimulate its economy.
🟢 Bullish Headline Arguments
Inflation up by 1.1% q/q in Q2 2023 vs. 1.2% in Q1, 0.9% expected. Annual CPI dropped from 6.7% to 6.0% in Q2 thanks to lower petrol prices and higher interest rates
🔴 Bearish Headline Arguments
Services PMI fell to 50.1 in June (52.5 forecast) from a revised 53.1 previous read; Employment index fell to 49.1 vs. 52.3 previous; New orders dipped to 51.3 vs. 55.4 previous
JPY Pairs
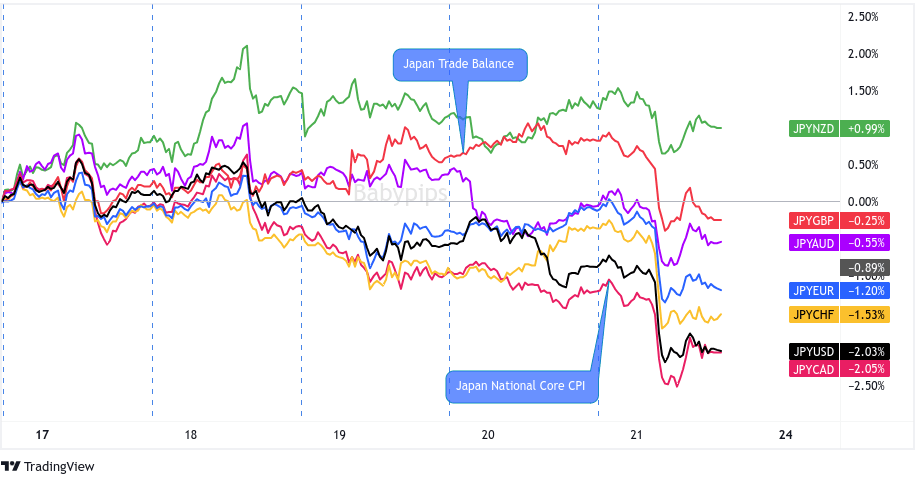
Overlay of JPY vs. Major Currencies Chart by TV
Much like other safe havens, risk aversion pushed the yen higher in the first half of the week.
But BOJ members sticking to their hawkish bias (despite a slightly higher national core CPI) made the currency less attractive against its major counterparts.
JPY weakened amidst risk-taking on Tuesday and slid on a slow and steady downtrend to end the week lower against all of its major counterparts except for NZD.
🟢 Bullish Headline Arguments
Japan posts first annual trade surplus in 23 months as exports grew by 1.5% y/y while imports dipped by 12.9% in June
🔴 Bearish Headline Arguments
BOJ Governor Kazuo Ueda hinted at extended ultra-loose policies, saying that “our overall narrative on monetary policy remains unchanged” if the prospect of sustained 2% inflation remains distant
Japan National Core CPI: 3.3% y/y (3.2% y/y forecast / previous)
Japanese government downgraded its economic outlook on Thursday from 1.5% for the fiscal year ending March 2024 to 1.3%; raised its 2023 consumer price inflation forecast to 2.6% from 1.7% prior
Sources familiar with the Bank of Japan said that the BOJ is likely leaning towards keeping yield control steady next week